
Free Marketing Budget Calculator
Use this free marketing spend calculator to estimate how much your campaign should cost and what results to expect. Enter your target customers, deal size, and conversion rates to get a recommended budget with ROI projection.
Marketing Budget Calculator FAQ
Common questions about marketing campaigns budget and ROI calculation for B2B companies
What is Average Deal Size? How to find it?
Average Deal Size (also called ASP = average sale price) is the average revenue you expect from each new customer acquired, typically calculated annually. For SaaS this can be your annual subscription price. You can simply find it in your CRM or BI tool. It's required to calculate ROI from the campaign.
What's the difference between CPL and CPC?
Cost per Lead (CPL) measures how much you pay for each lead (e.g. for a book a demo form or webinar form), while Cost per Click (CPC) measures the cost of each click on your ad. CPL is typically at least 10x higher than CPC since not every click converts to a lead. B2B companies should use the cost per lead or CPA (cost per action e.g. signup) as the key conversion metric. CPC is commonly used for top of the funnel campaigns and e-commerce.
How should I calculate my lead to customer conversion rate?
Your target conversion rate should be based on historical data or industry benchmarks, if you don't have data. CR depends on how do you define a 'lead'. If your lead is coming from lead magnet form then the CR to customer will be lower than if you define a lead someone who completed book a demo form (later in the funnel). For B2B companies, lead-to-customer rates typically range from 2-15%, the click to lead rate (landing page conversion rate) should be between 5-30%.
What factors affect my Cost per Lead (CPL)?
CPL is the outcome of: your industry and target audience size (the narrower, the higher the CPL), your market competitiveness (smaller and more competitive market means higher CPL), marketing channel (e.g. LinkedIn has higher CPL than Google or Meta, but better targeting), and your offer attractiveness. CPL also depends on your lead definition (e.g. demo request vs webinar registration) and landing page factors like form length and content uniqueness (e.g. a generic case study will convert worse than unique industry insights).
How can I improve my marketing campaign ROI?
Optimize your funnel conversions with email nurturing and paid remarketing, narrow down targeting to best-performing segments, run A/B tests on your messaging and landing pages, improve ad quality and messaging, and optimize for high-intent keywords. ROI is all about minimizing the marketing cost and maximizing conversion rates in the funnel.
What counts as a 'Lead'?
In B2B, a lead is typically someone who has shown interest in our company's content, product or service by completing a website form with business email, contact information, company information. Usually lead is defined as a lifecycle stage before any purchase intent and it should be further nurtured, scored and qualified as MQL and SQL, to finally become a customer. When using this calculator, adjust your lead conversion rate based on your specific definition.
How to Plan and Allocate Your Marketing Budget
When planning a marketing campaign, one of the most common questions companies ask is how much to spend on marketing. Use this marketing budget calculator to figure out how to meet your targets. Are there any specific benchmarks? If you spend more, will you keep the same ROI? The answer often depends on the size of the company, the industry, channel, and the specific goals of the campaign. Consider breaking down your annual marketing budget into a monthly budget to better manage and allocate resources across different marketing channels.
Why do you need a Marketing Budget?
You should treat a marketing budget as an investment into your company growth. It enables your team to execute campaigns and test new marketing ideas effectively. A clear marketing budget aligns spending with revenue growth targets.
A well managed marketing budget shows exactly how much money goes into different marketing activities and allows moving dollars around flexibly when needed. It ensures your team has sufficient budgets allocated to execute marketing strategies and reach the marketing KPI targets. Without a marketing budget, company's spending becomes chaotic.
Without the approved budget, the team gets stuck waiting for expense approvals on each campaign, tool or new hire. This makes it impossible to execute marketing initiatives smoothly or react quickly to market changes and competitor moves. Without marketing budget, your marketing efforts fail to deliver the best possible returns.
Are there any proven marketing spend allocation strategies?
There isn't a one-size-fits-all marketing spend allocation strategy that works for every business. However, you can consider the following approaches when distributing your marketing budget across different channels:
Categorize your marketing budget: Break down all line items into four categories: acquisition, brand, conversion, and operational.
Allocate 50-70% into acquisition, 10-20% into operational actions (e.g. tools), 20-30% into conversion, 0-20% into brand campaigns
Always start with acquisition budgets.This marketing budget calculator can be used specifically for budget calculation for a customer or lead acquisition campaign.
Allocate 50% of your budget to proven channels: Dedicate half of your budget to channels that have already proven effective for your business.
Allocate 30% to new channels or experiments: Reserve about a third of your budget for testing new marketing channels or experimental campaigns. Scale up investments in those that show positive results.
Allocate 0-20% to branding and awareness: Invest in branding and hard-to-measure awareness initiatives when you optimized acquisition an conversion efforts. These efforts are often expensive and challenging to evaluate.
Focus on fewer channels to draw meaningful conclusions and observe the effects of scale. Doing a little bit of everything doesn't work and leads to inconclusive results.
Monitor and adjust: Continuously track your marketing spend and adjust your allocation strategy to optimize ROI.
Follow the Etropo step-by-step guide on the marketing budget planning to get more tips!
How to Calculate the Marketing Budget
The marketing budget formula involves several factors: the company's growth appetite, market competitors, target audience, marketing channels, and estimated gross revenue. This marketing spend calculator is a simple tool to provide you with a number based on your historic or target data. A full checklist for marketing budget calculation includes:
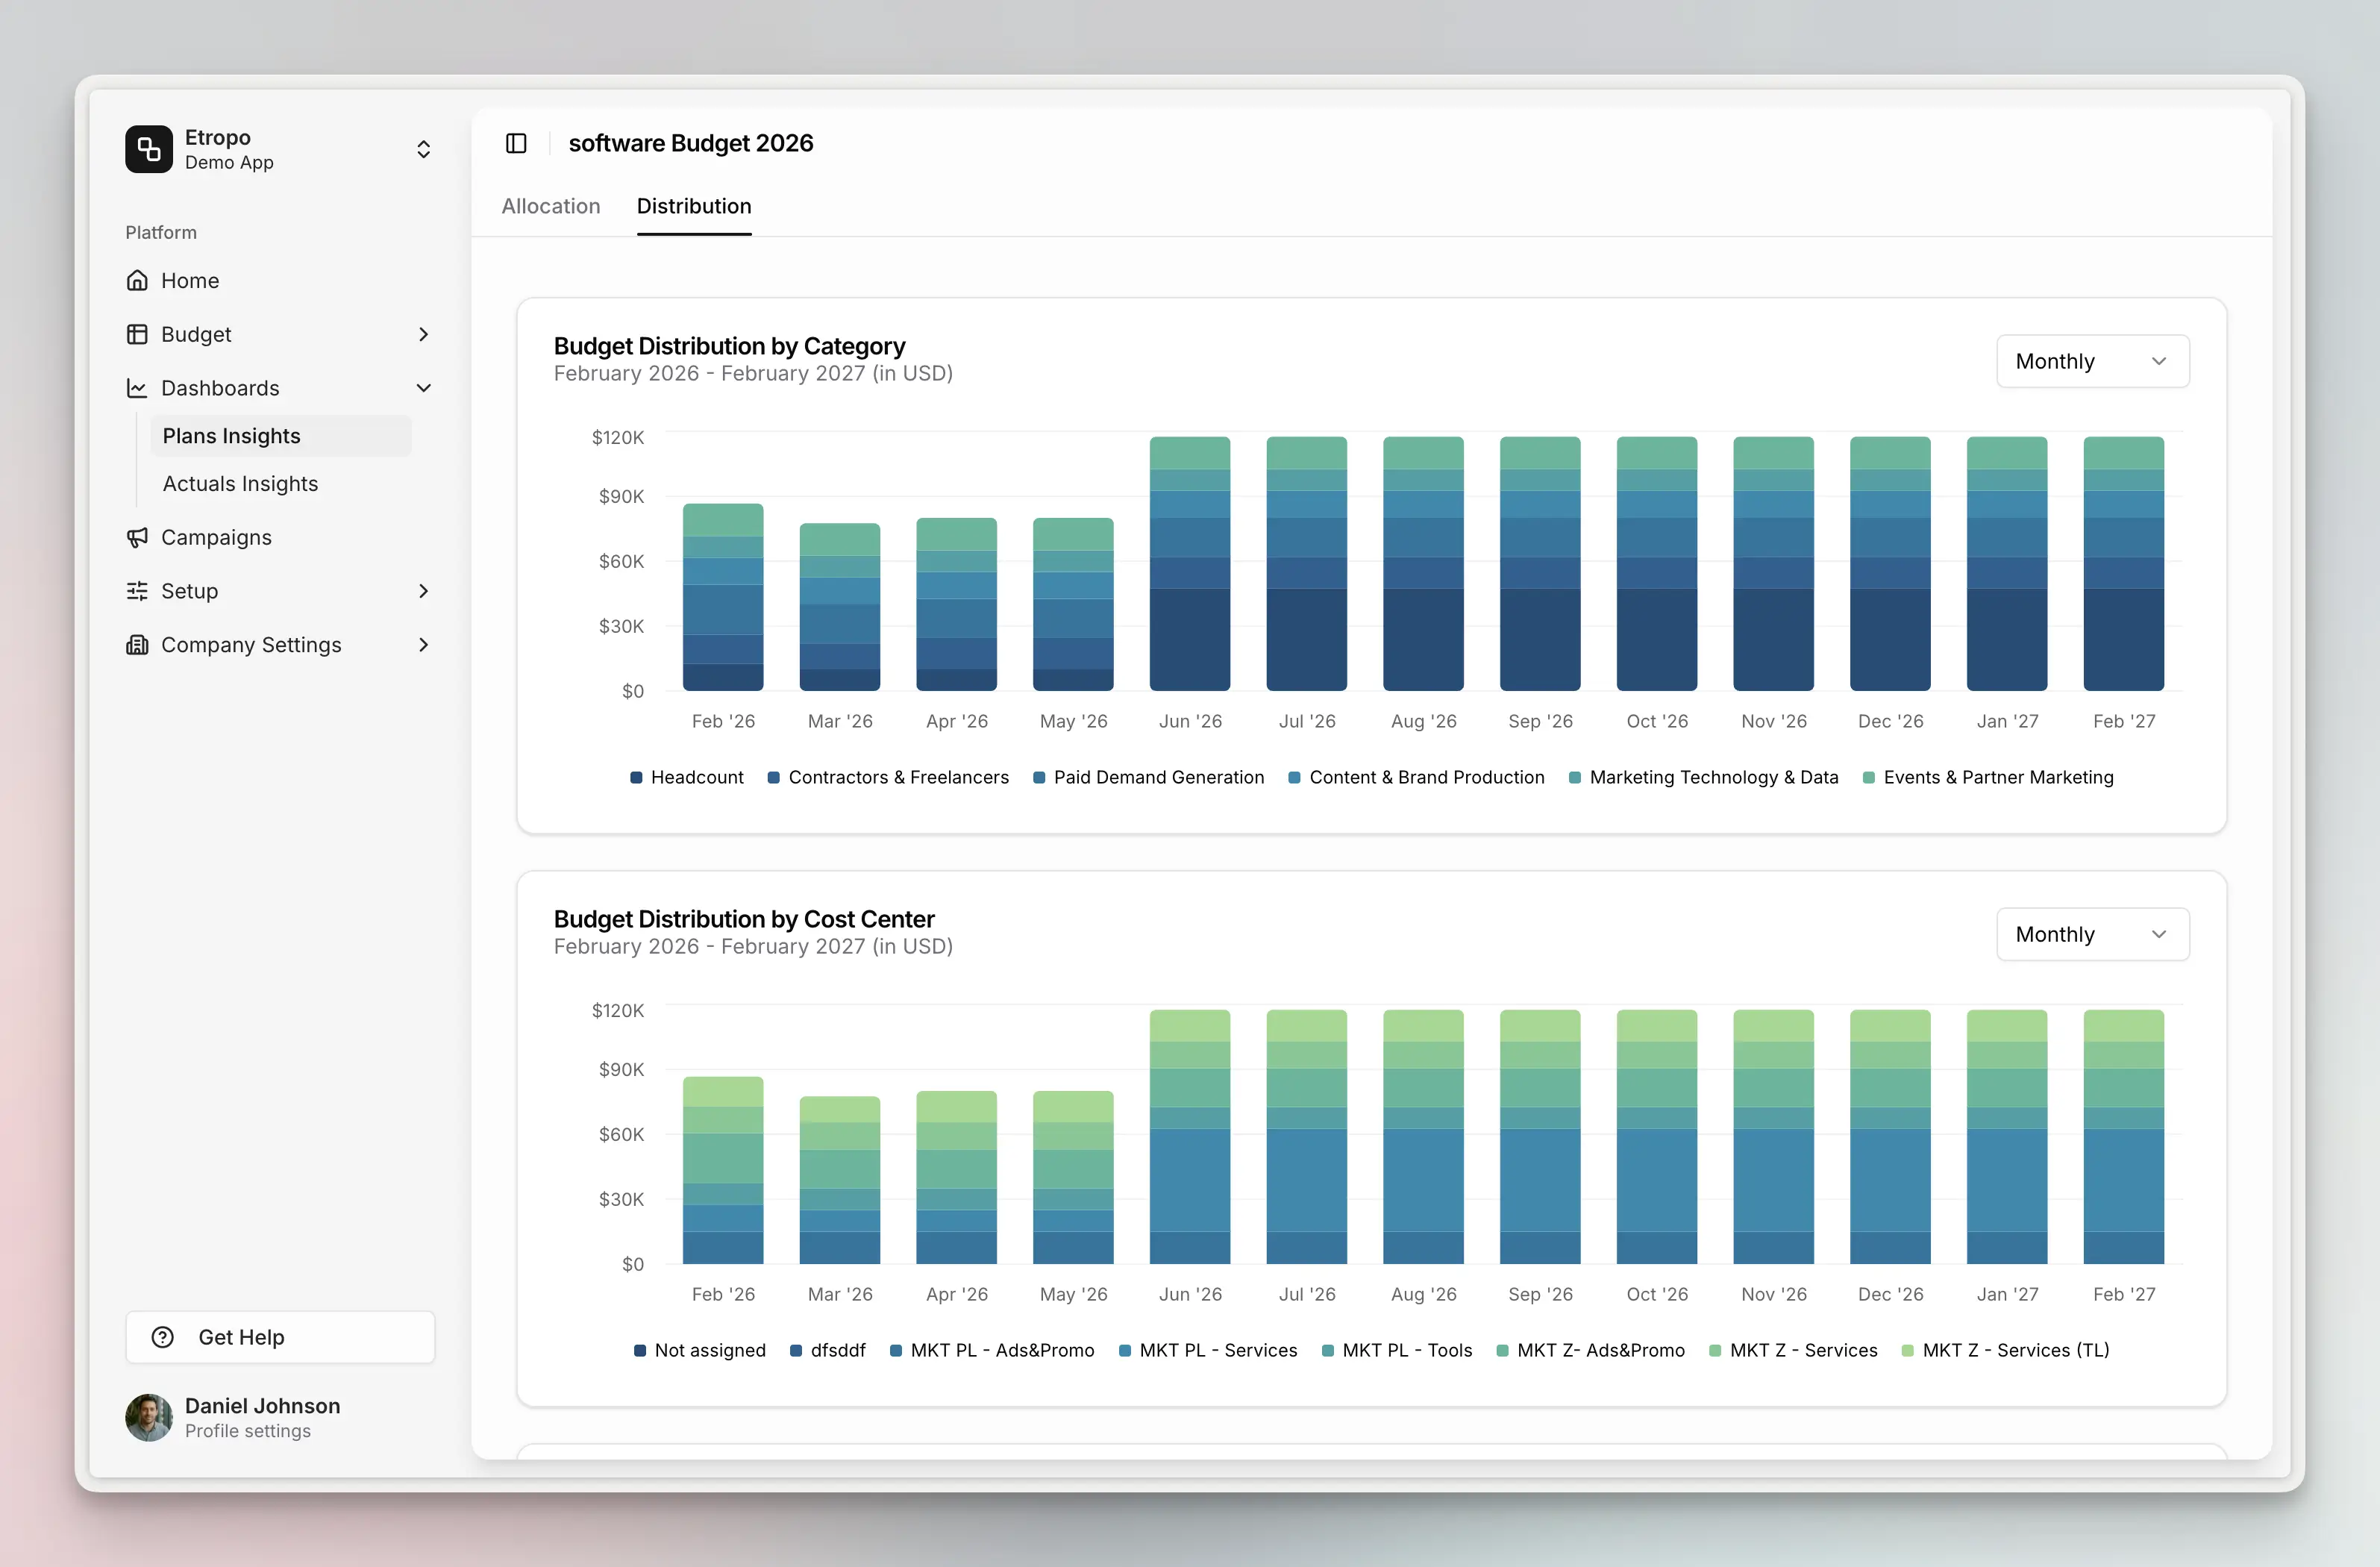
Set marketing objectives: What do you want to achieve with your marketing initiatives? Increase brand awareness, generate leads, or drive website sales?
Identify target audience: Who are your ideal customer profiles (ICP)? How can you find them? What are their behaviors?
Choose marketing channels: Which channels will you use to reach your target audience? Should you include online, offline, or both? Will you leverage social media, email marketing, paid ads, or organic search?
Estimate gross revenue:What is the company's estimated annual revenue? How much profit do you make per sale, and what are your regular business costs? Understanding these numbers will help you determine how much you can realistically allocate to marketing without straining your finances.
Set a target customer acquisition cost (CAC): How much can the business afford to spend to acquire a new customer? How does this cost align with your expected revenue per customer and overall profitability goals? Defining a realistic CAC is a basis in the marketing budget calculator and it ensures your marketing campaign is financially sustainable.
Start with this advertising budget calculator to get your baseline numbers, then follow Etropo's step-by-step guide on marketing budget planning to build your own approach!
Once you have your total budget figured out, use our industry-specific marketing budget templates to see how to allocate it across channels for your vertical. If you are running a small business, check our small business marketing budget benchmarks for data-backed guidance by industry and growth stage.
What are the common marketing budget mistakes?
One of the most common mistakes is starting just and only with paid ads. It's short term, leads to inefficient use of resources and poor ROI. Focusing only on paid ads is a short-term strategy.
Another mistake is missing a single source of truth for marketing KPIs and costs, making it difficult to spend wisely the marketing budgets.
Businesses should also avoid allocating too little budget to single marketing channel, as this results in having not enough data to drive conclusions.
When planning marketing budgets, CMOs' mistake is avoiding budgets discussion with the marketing team members. All marketing team members should own their line items, and CMOs should involve the whole team into collaboration on the KPIs and budget calculation.
What are the Marketing Budget Benchmarks?
How much should you spend on marketing? Marketing budgets should be calculated as a percentage of a company's annual revenue. Usually, companies invest between 2% to 25% of their revenue into marketing. Conservative businesses allocate 2-10% of their revenue to marketing initiatives. Companies with aggressive growth plans invest 10-15% or more of their revenue.
Your ideal marketing budget depends on your industry type and company size. The less unique your product or service is, and the more competitive the market is, the higher marketing investment you need to make. In competitive markets, using specialized budget management tools helps you optimize spending. If the product or service is exceptional, a company might succeed with a $0 marketing budget. How? Satisfied customers become the best marketers through word of mouth.